Home / Research examples / AI stocks with 30% revenue growth near 52-week lows
Which AI stocks grew revenue 30% or more and sit closest to their 52-week lows?
A screening question with two parts: a fundamental filter, then a ranking by price position. It shows how each platform handles a question that mixes financial statements with price data.
The company says so in its own docs. The source is linked and dated.
I ran it and this is what happened. Inputs and steps are shown.
My judgment. You may weigh the same facts differently.
The test
- Question
- Find AI stocks with at least 30% year-over-year revenue growth, then rank them by how close the current price is to the 52-week low.
- Inputs
- Universe: US-listed common stocks each platform classifies as AI. Each platform chose its own definition of year-over-year revenue growth, recorded with its run. Prices as of the last completed session before the test.
- Method
- Ask each platform the question once, in plain English, through its AI assistant.
- Record the time from sending the question to the finished answer.
- Save what each platform returned: the ranked list, or its stated reason for returning none.
- Result
- Observed
NexusTrade QuantConnect Composer Finished without writing code Yes Yes, the assistant wrote the Python Yes Question to ranked list 5 min 35 sMessage sent 03:37:39 UTC; the answer finished at 03:43:14 UTC. 26 min 37 sMessage sent to the first backtest starting. QuantConnect has no stock screener, so its assistant built and backtested a strategy from the rule and did not list the stocks. 55 sMessage sent 23:20:08 UTC; the answer stopped growing at 23:21:03 UTC. Stocks returned 81 (top 25 shown) No list: it has no screener No list: no revenue or 52-week-low data - Limits
- "AI stock" has no standard definition, and each platform draws the universe differently. A stock near its 52-week low is often there for a reason. This is a screen and says nothing about what happens next.
The results
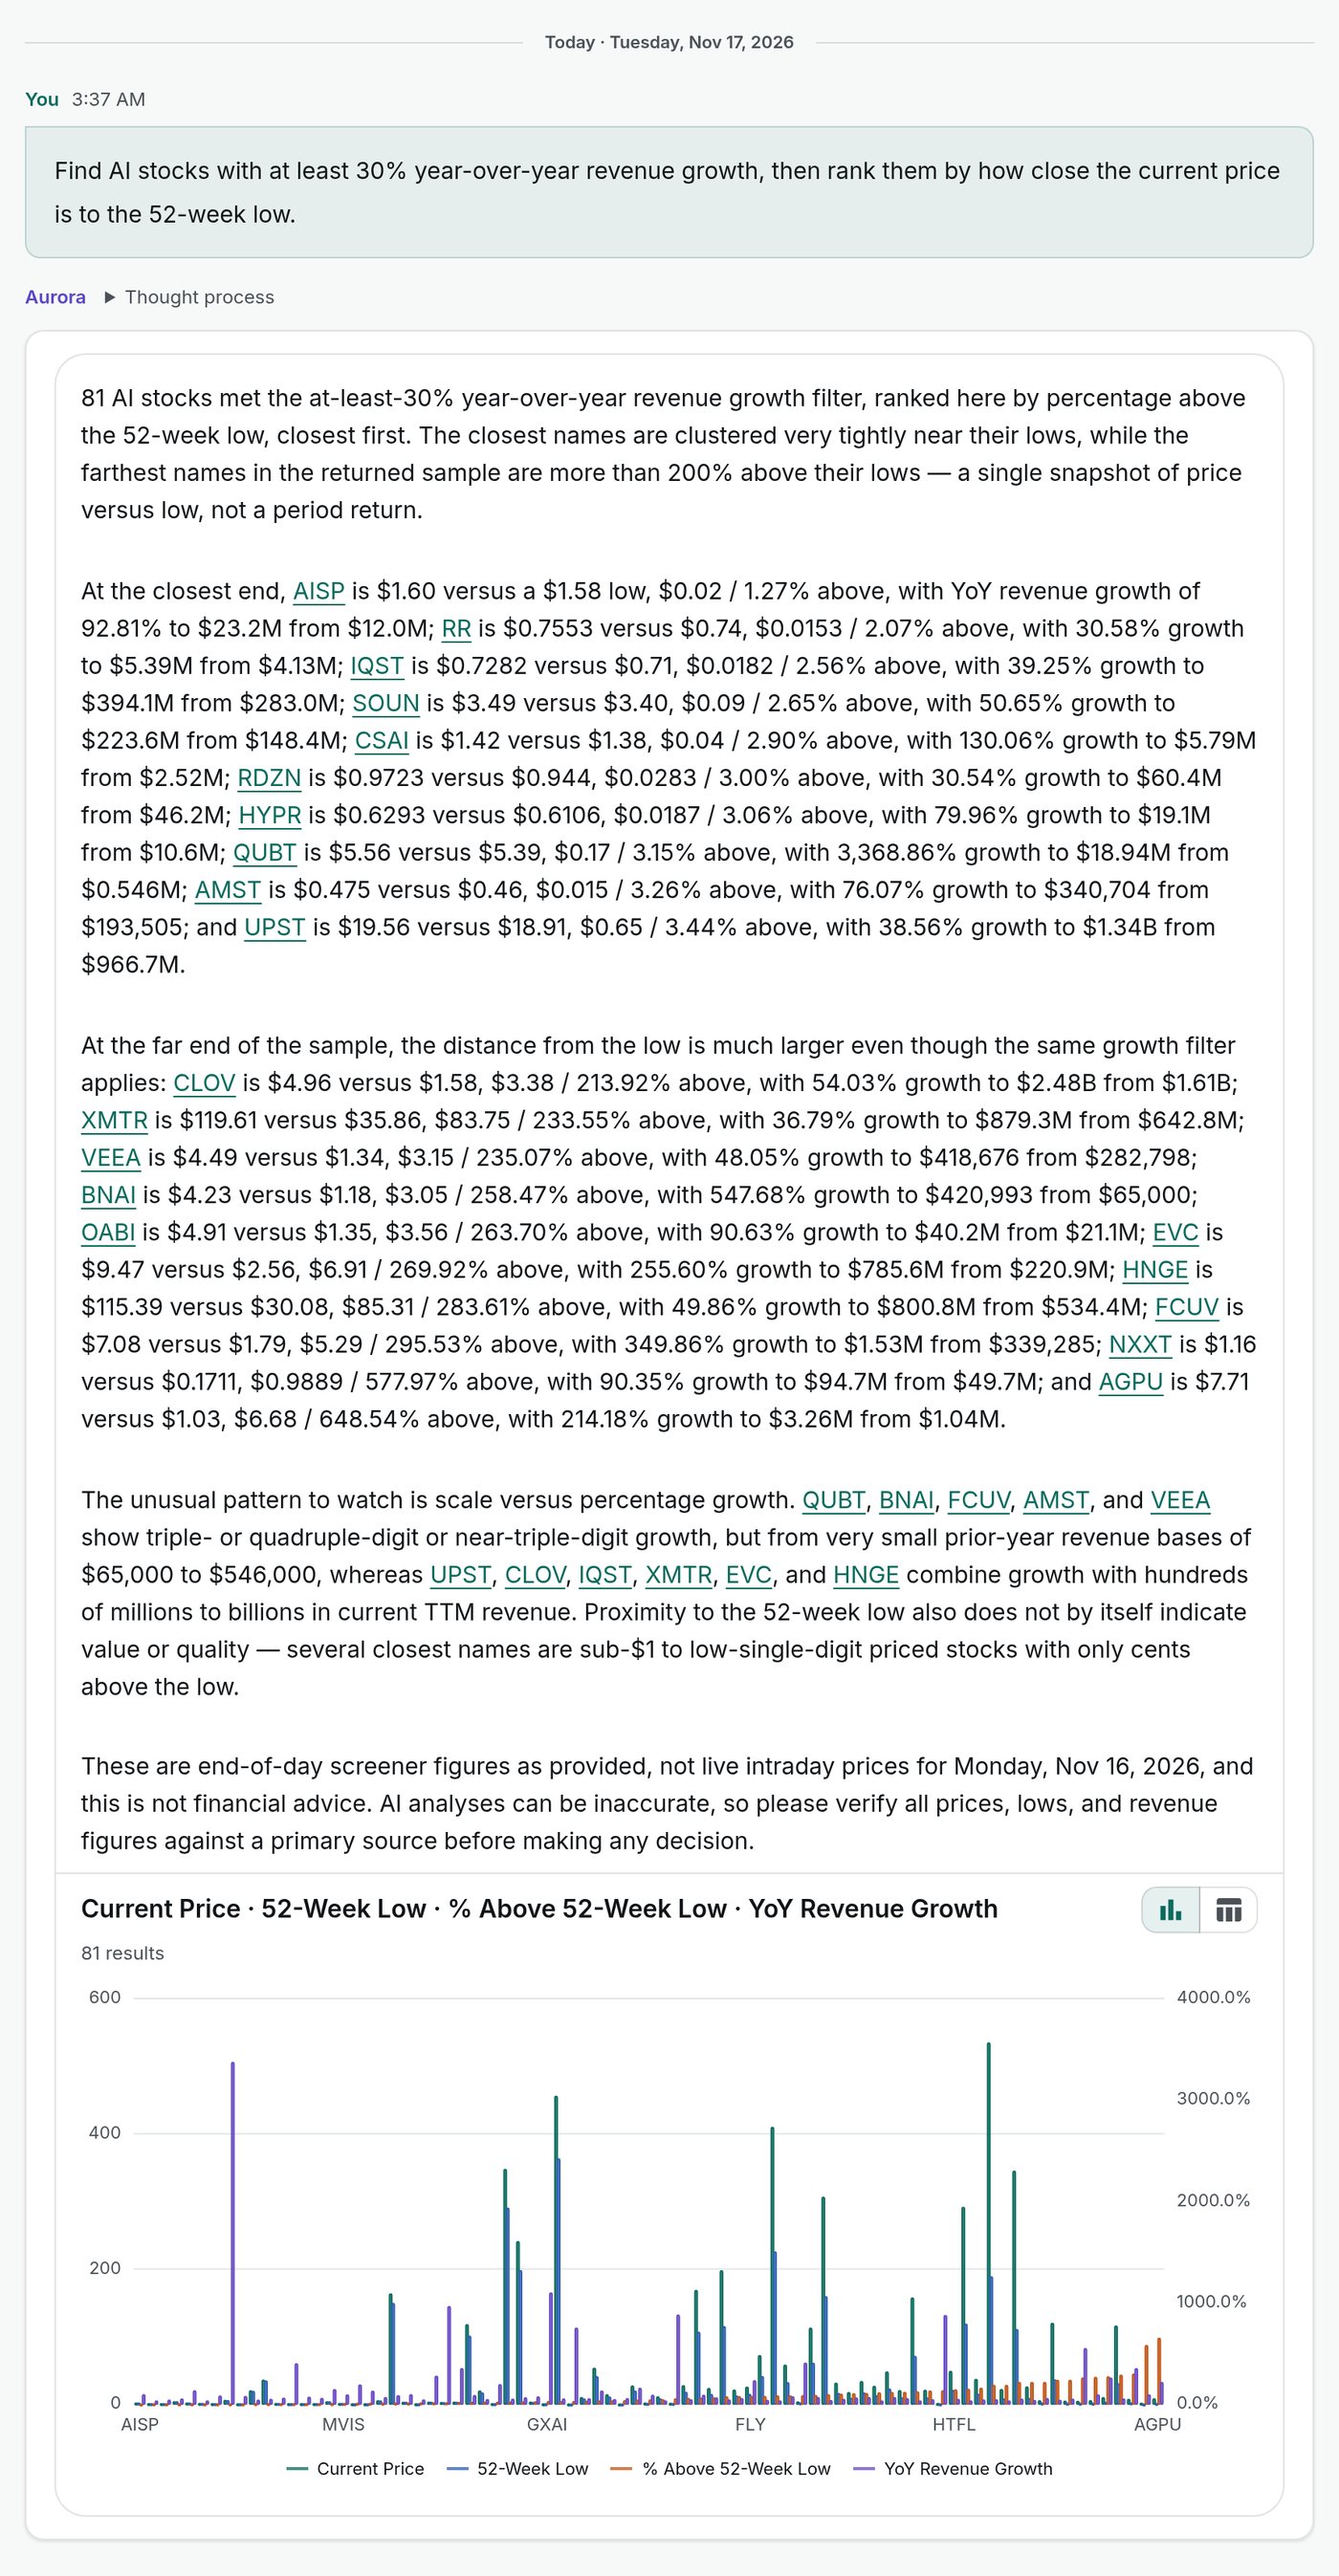
ObservedNexusTrade: what it returned
The top 25 of 81 stocks, ranked by how close the price is to the 52-week low
| # | Ticker | Price | 52-week low | Above the low | Revenue growth | Revenue, last 12 months | Revenue, year before |
|---|---|---|---|---|---|---|---|
| 1 | AISP | $1.60 | $1.58 | 1.27% | +92.8% | $23.20M | $12.03M |
| 2 | RR | $0.76 | $0.74 | 2.07% | +30.6% | $5.39M | $4.13M |
| 3 | IQST | $0.73 | $0.71 | 2.56% | +39.2% | $394.07M | $282.99M |
| 4 | SOUN | $3.49 | $3.40 | 2.65% | +50.6% | $223.58M | $148.40M |
| 5 | CSAI | $1.42 | $1.38 | 2.90% | +130.1% | $5.79M | $2.52M |
| 6 | RDZN | $0.97 | $0.94 | 3.00% | +30.5% | $60.35M | $46.23M |
| 7 | HYPR | $0.63 | $0.61 | 3.06% | +80.0% | $19.06M | $10.59M |
| 8 | QUBT | $5.56 | $5.39 | 3.15% | +3,368.9% | $18.94M | $546.0K |
| 9 | AMST | $0.48 | $0.46 | 3.26% | +76.1% | $340.7K | $193.5K |
| 10 | UPST | $19.56 | $18.91 | 3.44% | +38.6% | $1.34B | $966.73M |
| 11 | INOD | $35.46 | $34.23 | 3.59% | +46.9% | $350.23M | $238.47M |
| 12 | MYSE | $1.03 | $0.99 | 3.71% | +58.4% | $499 | $315 |
| 13 | LIDR | $0.74 | $0.72 | 3.71% | +397.8% | $906.0K | $182.0K |
| 14 | MYSZ | $0.68 | $0.66 | 3.74% | +67.3% | $11.34M | $6.78M |
| 15 | NEON | $0.58 | $0.56 | 4.50% | +56.2% | $2.15M | $1.37M |
| 16 | HCTI | $3.66 | $3.50 | 4.57% | +141.9% | $31.30M | $12.94M |
| 17 | MVIS | $1.05 | $0.98 | 7.10% | +90.9% | $5.03M | $2.63M |
| 18 | BLNE | $0.45 | $0.42 | 7.49% | +188.3% | $10.21M | $3.54M |
| 19 | KSCP | $0.42 | $0.39 | 7.56% | +126.2% | $26.26M | $11.61M |
| 20 | DUOT | $5.03 | $4.66 | 7.95% | +64.0% | $25.23M | $15.39M |
| 21 | NVDA | $162.85 | $148.80 | 9.44% | +83.4% | $302.97B | $165.22B |
| 22 | SPAI | $2.77 | $2.52 | 9.92% | +92.6% | $2.88M | $1.50M |
| 23 | AIRE | $0.36 | $0.32 | 11.17% | +41.0% | $4.29M | $3.04M |
| 24 | GLOO | $2.90 | $2.60 | 11.75% | +275.4% | $154.29M | $41.09M |
| 25 | ZSQR | $2.38 | $2.11 | 12.56% | +961.2% | $2.80M | $263.6K |
Prices are from the November 13, 2026 close. Revenue growth compares the last twelve months of reported revenue with the twelve months before. MYSE's revenue is shown correctly in dollars: the company's filings report $499 for those twelve months.
QuantConnect: what it returned
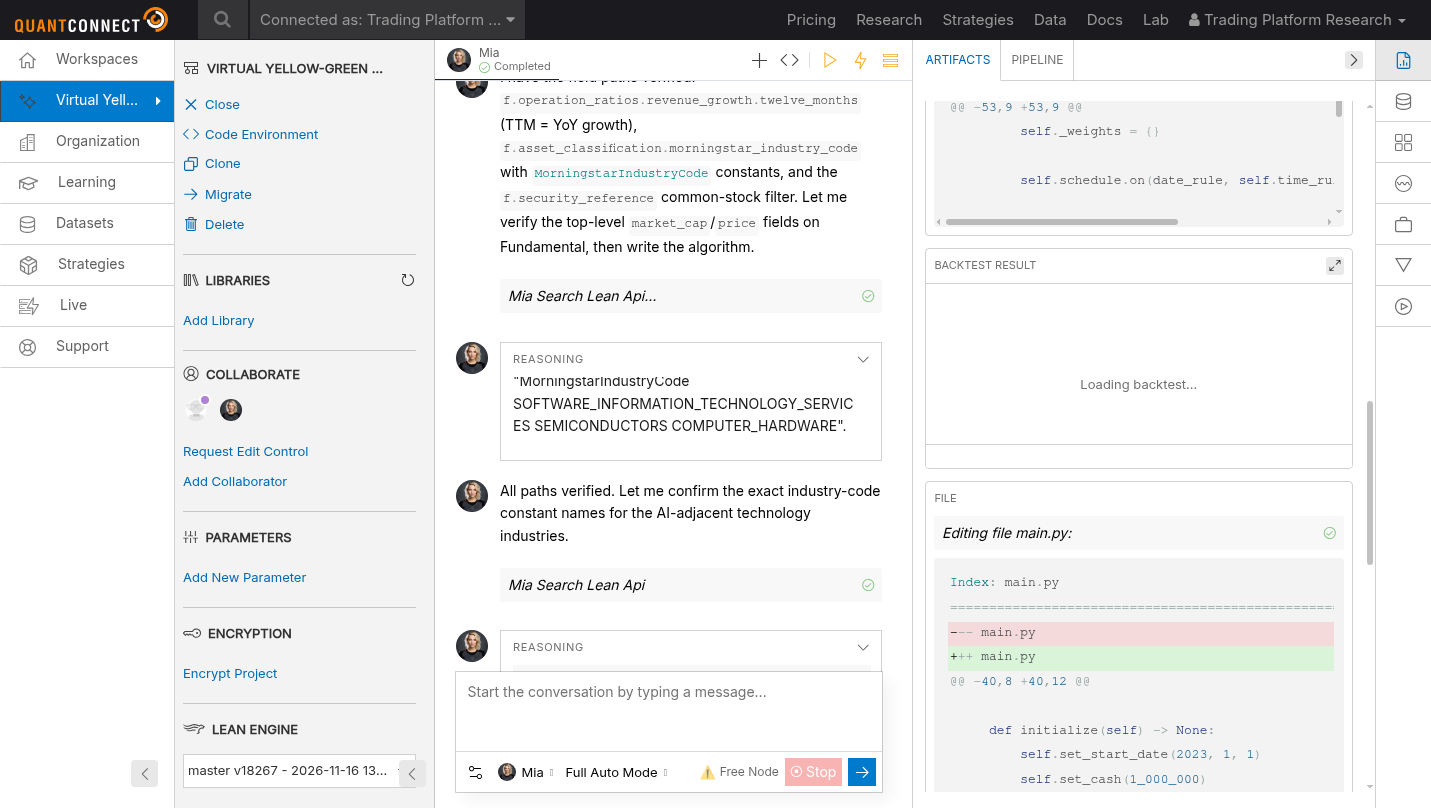
QuantConnect returned a trading algorithm and two backtests
QuantConnect has no stock screener, so its assistant answered a different question from the one I asked. It wrote a Python algorithm that picks stocks by Morningstar industry code and trailing revenue growth, rebalances into the names closest to their 52-week lows, and backtests that from January 2023 to August 2026.
The first backtest returned +3.415% and a second version returned +94.457%. Neither produced a list of the stocks that pass the screen today.
Composer: what it returned
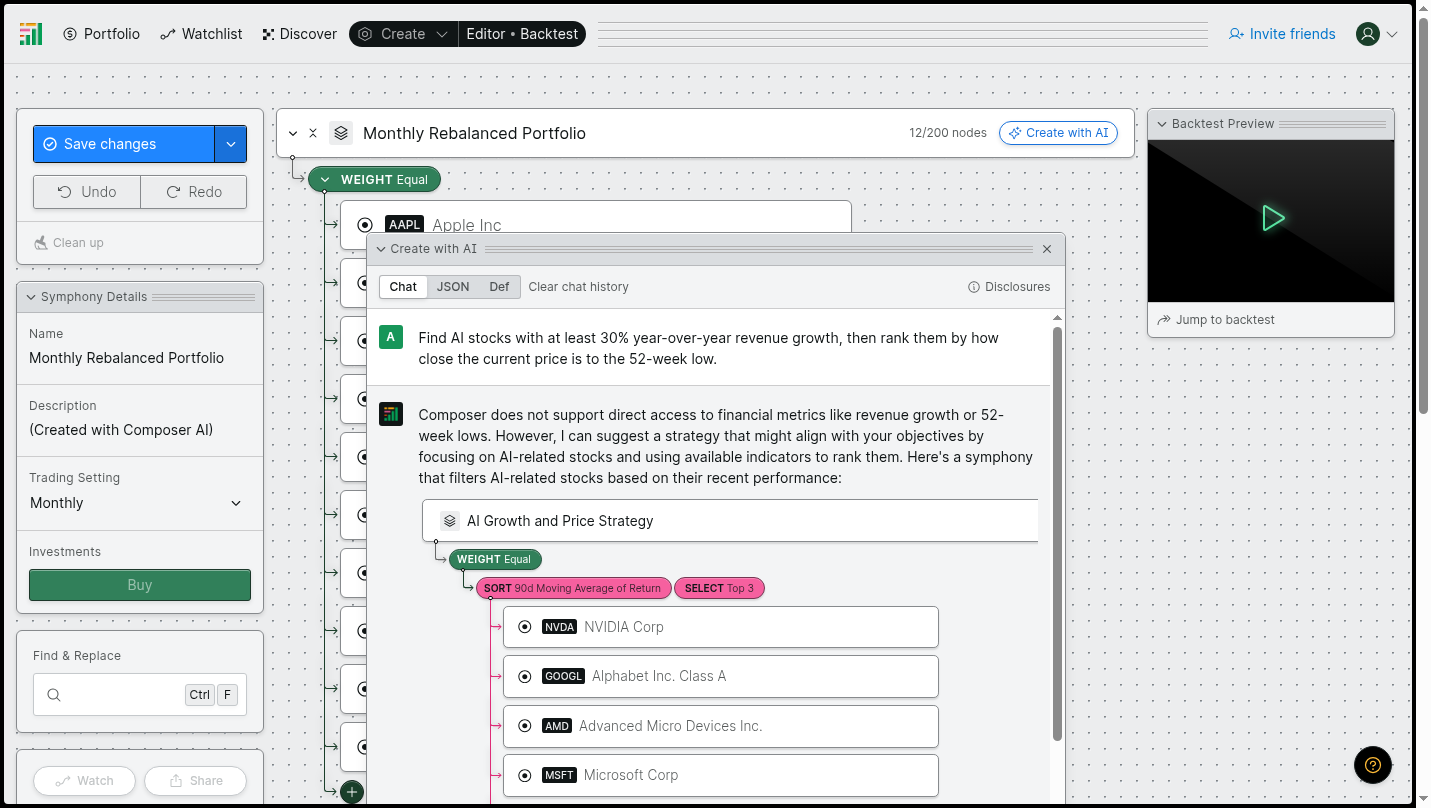
Composer said it has no revenue growth or 52-week-low data
"Composer does not support direct access to financial metrics like revenue growth or 52-week lows."
It offered a different strategy in its place: hold the top 3 of seven stocks it chose (NVDA, GOOGL, AMD, MSFT, META, TSLA, INTC), ranked by their 90-day moving average of return.
Quoted from Composer's assistant.