Home / Research examples / Fundamentally strong stocks that beat the Nasdaq
What fundamentally strong stocks beat the Nasdaq?
I typed the same seven words into three platforms. NexusTrade and QuantConnect answered with a list of stocks, using different definitions of strong and different time windows. Composer offered a momentum strategy and no list.
The company says so in its own docs. The source is linked and dated.
I ran it and this is what happened. Inputs and steps are shown.
My judgment. You may weigh the same facts differently.
The test
- Question
- What fundamentally strong stocks beat the Nasdaq?
- Inputs
- The sentence above and nothing else, typed on November 16, 2026. Each platform chose its own definition of fundamentally strong, its own benchmark and its own time window.
- Method
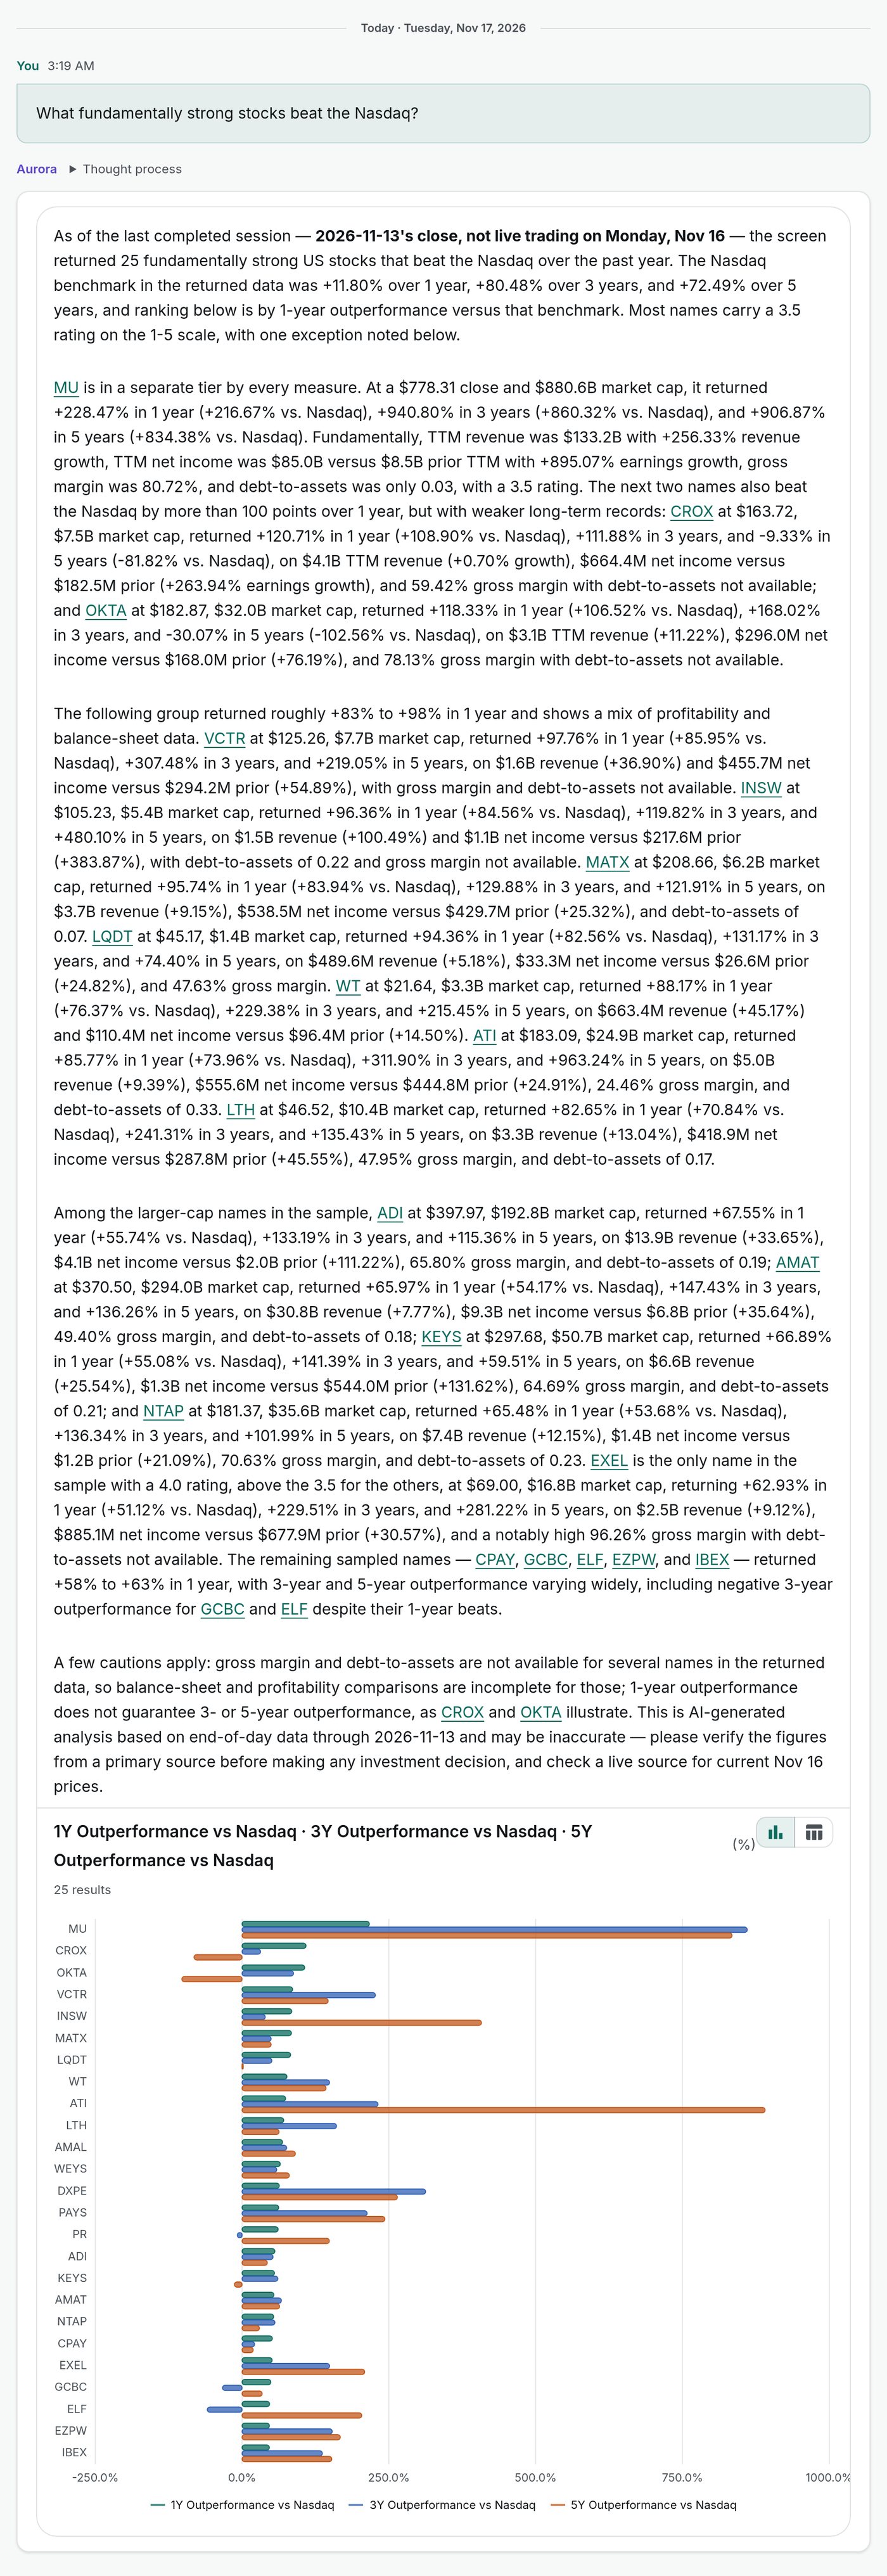
- NexusTrade's stock screener defined strong as a stock report rating of 3.5 or higher on its 1 to 5 scale, and compared each stock's one-year return with the Nasdaq.
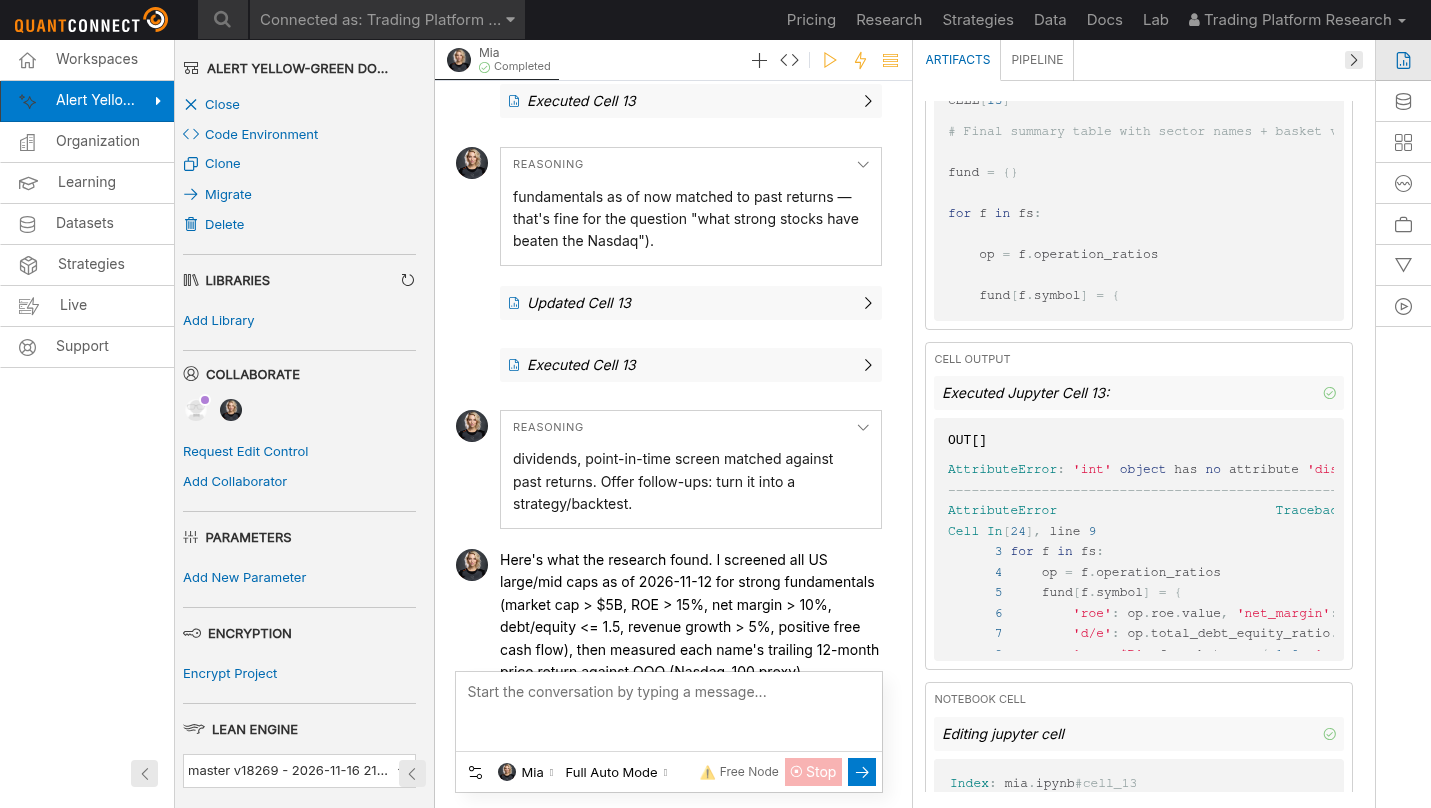
- QuantConnect's assistant wrote a research notebook in Python. It screened US large and mid caps for market cap above $5 billion, return on equity above 15%, net margin above 10%, debt to equity of 1.5 or less, revenue growth above 5% and positive free cash flow, then compared each stock's 12-month price return with QQQ.
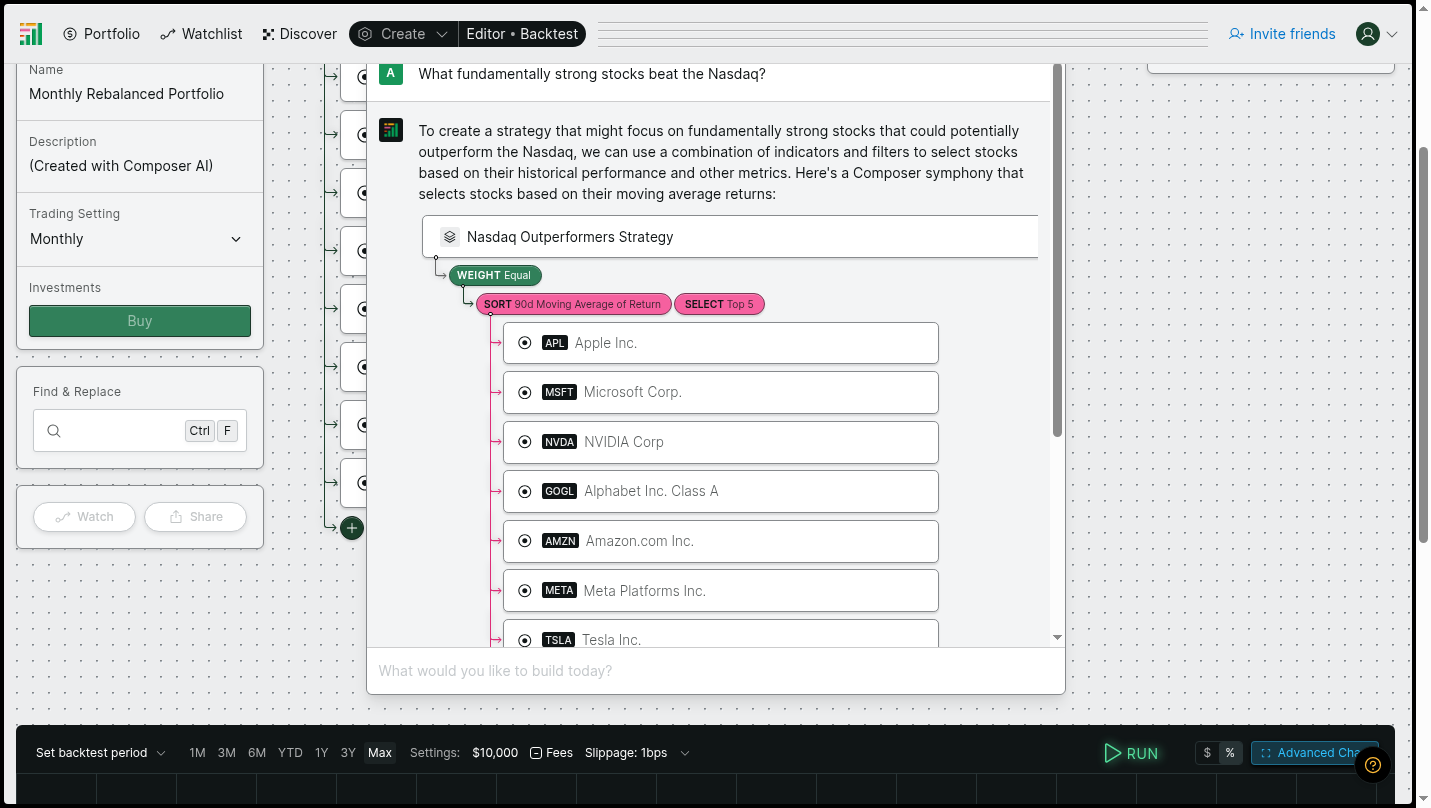
- Composer's assistant wrote a strategy that ranks ten large stocks by their 90-day moving average of return.
- Result
- Observed
NexusTrade QuantConnect Composer Answered without writing code Yes Yes, the assistant wrote the Python Yes Time from question to answer 3 min 13 sMessage sent 03:19:22 UTC; the answer finished at 03:22:35 UTC. 5 min 35 sMessage sent 03:05:22 UTC in a new task; QuantConnect's status changed to Completed between 03:10:52 and 03:11:02 UTC. 1 min 20 sMessage sent 02:11:35 UTC; the answer stopped growing at 02:12:55 UTC. Its definition of strong Stock report rating of 3.5 or higher Six fundamental thresholds, 191 stocks passed None: it ranked ten large stocks by recent return Window and benchmark 1 year to November 13, 2026, against the Nasdaq-100 (+11.8%) Trailing 12 months, against QQQ (+11.6%) None given Stocks that beat the benchmark 25 shown, ranked by margin 107 of 191 No list - Limits
- Both lists look backward: they show which strong companies won, and say nothing about which will win next. The platforms answered different versions of the question, so the lists are not directly comparable. QuantConnect chose its stocks on current fundamentals and then measured the 12 months before, which favours companies that have already done well.
The results
ObservedNexusTrade: what it returned
Stocks rated 3.5 or higher that beat the Nasdaq over one year
| # | Ticker | Rating (1 to 5) | Price | 1-year return | Ahead of the Nasdaq-100 |
|---|---|---|---|---|---|
| 1 | MU | 3.5 | $778.31 | +228.5% | +216.7 pts |
| 2 | CROX | 3.5 | $163.72 | +120.7% | +108.9 pts |
| 3 | OKTA | 3.5 | $182.87 | +118.3% | +106.5 pts |
| 4 | VCTR | 3.5 | $125.26 | +97.8% | +86.0 pts |
| 5 | INSW | 3.5 | $105.23 | +96.4% | +84.6 pts |
| 6 | MATX | 3.5 | $208.66 | +95.7% | +83.9 pts |
| 7 | LQDT | 3.5 | $45.17 | +94.4% | +82.6 pts |
| 8 | WT | 3.5 | $21.64 | +88.2% | +76.4 pts |
| 9 | ATI | 3.5 | $183.09 | +85.8% | +74.0 pts |
| 10 | LTH | 3.5 | $46.52 | +82.7% | +70.8 pts |
| 11 | AMAL | 3.5 | $50.35 | +80.7% | +68.9 pts |
| 12 | WEYS | 3.5 | $58.92 | +76.8% | +65.0 pts |
| 13 | DXPE | 3.5 | $153.56 | +75.1% | +63.3 pts |
| 14 | PAYS | 3.5 | $9.52 | +74.0% | +62.2 pts |
| 15 | PR | 3.5 | $23.05 | +73.2% | +61.4 pts |
| 16 | ADI | 3.5 | $397.97 | +67.5% | +55.7 pts |
| 17 | KEYS | 3.5 | $297.68 | +66.9% | +55.1 pts |
| 18 | AMAT | 3.5 | $370.50 | +66.0% | +54.2 pts |
| 19 | NTAP | 3.5 | $181.37 | +65.5% | +53.7 pts |
| 20 | CPAY | 3.5 | $462.22 | +63.3% | +51.5 pts |
| 21 | EXEL | 4 | $69.00 | +62.9% | +51.1 pts |
| 22 | GCBC | 3.5 | $35.60 | +60.7% | +48.9 pts |
| 23 | ELF | 3.5 | $117.98 | +58.6% | +46.8 pts |
| 24 | EZPW | 3.5 | $27.55 | +58.2% | +46.4 pts |
| 25 | IBEX | 3.5 | $56.92 | +58.2% | +46.4 pts |
Returns run for one year to the November 13, 2026 close. 24 of the 25 carry a rating of 3.5 and one, EXEL, is rated 4. It also returned each stock's three-year and five-year return, revenue, earnings growth and margins.
QuantConnect: what it returned
The top of QuantConnect's list, by 12-month return
| # | Ticker | 12-month price return | Ahead of QQQ |
|---|---|---|---|
| 1 | MU | +237% | +225 pts |
| 2 | SEZL | +169% | +157 pts |
| 3 | SN | +146% | +135 pts |
| 4 | INSW | +122% | +111 pts |
| 5 | FRO | +119% | +107 pts |
| 6 | TGTX | +111% | +100 pts |
| 7 | VCTR | +107% | +95 pts |
| 8 | TXN | +98% | +87 pts |
| 9 | ALEX | +97% | +85 pts |
| 10 | APA | +96% | +84 pts |
| 11 | MRVL | +89% | +78 pts |
| 12 | WDC | +85% | +73 pts |
| 13 | RPRX | +83% | +72 pts |
| 14 | VICR | +82% | +70 pts |
| 15 | AMAT | +74% | +62 pts |
QuantConnect reported that 191 stocks passed its screen and 107 of them beat QQQ's 11.6% over the trailing 12 months. The table shows the 15 it listed. Returns are price only. It screened on current fundamentals, then looked back 12 months.
Composer: what it returned
Composer offered a momentum strategy and no list
"Here's a Composer symphony that selects stocks based on their moving average returns"
The strategy holds the top 5 of ten large stocks (AAPL, MSFT, NVDA, GOOGL, AMZN, META, TSLA, AVGO, JPM, LLY), ranked by their 90-day moving average of return. It used no fundamental data and named no stocks that beat the Nasdaq.
Quoted from Composer's assistant.